Topic outline

  • IBD Fundamentals

    In this module, we will explore key aspects of IBD, including its definition and epidemiology as well as diagnosis, treatment, health maintenance, and preventative care. Additionally, we will highlight the crucial role of patient-provider partnerships, shared decision-making, approaches to patient education and empowerment, and efforts to address social determinants of health (SDOH) and racial disparities in IBD care.

  • As IBD becomes increasingly prevalent, understanding its impact is more important than ever. This infographic explores changing demographics, key challenges, and opportunities to help advance patient care.

    Maia Kayal, MD

    Developed in collaboration with Maia Kayal, MD
    Paid consultant for Takeda Pharmaceuticals.

    Learn more
    • As IBD becomes increasingly prevalent, understanding its impact is more important than ever.1

      Explore the changing demographics, key challenges, and opportunities to help advance patient care.

      Scroll

      Epidemiological stages of IBD evolution1

      Stage 1

      Emergence

      What:
      Sporadic cases begin to appear

      Where:
      Developing countries

      Stage 2

      Accelerating Incidence

      What:
      Incidence increases, but prevalence remains low

      Where:
      Newly industrialized countries


      Stage 3

      Compounding Prevalence

      What:
      Incidence stabilizes, but prevalence rises sharply

      Where:
      Western nations

      Stage 4

      Prevalence Equilibrium

      What:
      Growth in prevalence levels off as incidence is offset by an aging IBD population

      Where:
      Predicted to begin in Western nations ~ year 2050

    • Annual incidence and prevalence rates of IBD in adults* by geographical region†2

      Incidence: Defined as the number of adult cases per 100,000 adult years.

      Prevalence: Defined as the number of cases in a region per 100,000 adults at a given time.

      Infographic showing global incidence and prevalence rates per 100,000 people, displayed on a stylized globe with statistics connected to each region by thin lines. Green pill-shaped labels show incidence per 100K: North America 7.3–30.2, Europe 10.5–46.1, Asia/Middle East 1.4–1.5, South America 0.2–3.7, Oceania 23.7–39.8. Teal pill-shaped labels show prevalence per 100K: North America 214.9–478.4, Europe 187–832, South America 1.8–70.1. Asia/Middle East and Oceania display only incidence data.

      Prevalence data from Asia/Middle East and Oceania are unavailable.
      *Adults aged 18 to 59 years of age.
      This data was compiled using key epidemiological studies published between 2006 and 2023.
      K=thousand.

    • Incidence, prevalence, and racial/ethnic distribution of IBD in the US

      Question

      Americans with IBD: more or less than 2M?

      Answer

      ~2.4M3
      (~1.3M=UC, ~1.0M=CD)

      Estimated based on extrapolated population data.

      Question

      What’s the prevalence of IBD by race?

      Answer

      1.6M
      Non-Hispanic White3
      224K
      Black3
      281K
      Hispanic3
      79K
      Asian3

      Estimated based on US population size of ~331 million.

      Question

      Has IBD been on the rise?

      Answer

      From 2007 to 2016 Prevalence Increased
      ↑123%
      for adult IBD overall
      ↑142%
      for adult UC
      ↑125%
      for adult CD

      Based on a meta-analysis of data from over 26M adult patients (age ≥18) with continuous coverage (year 2007 through 2016) from 2 large, geographically diverse administrative health claims databases across all 50 US states.4

      Question

      How much is IBD projected to grow by 2030?

      Answer

      From 2010–2030
      ~2x1

      K=thousand; M=million.

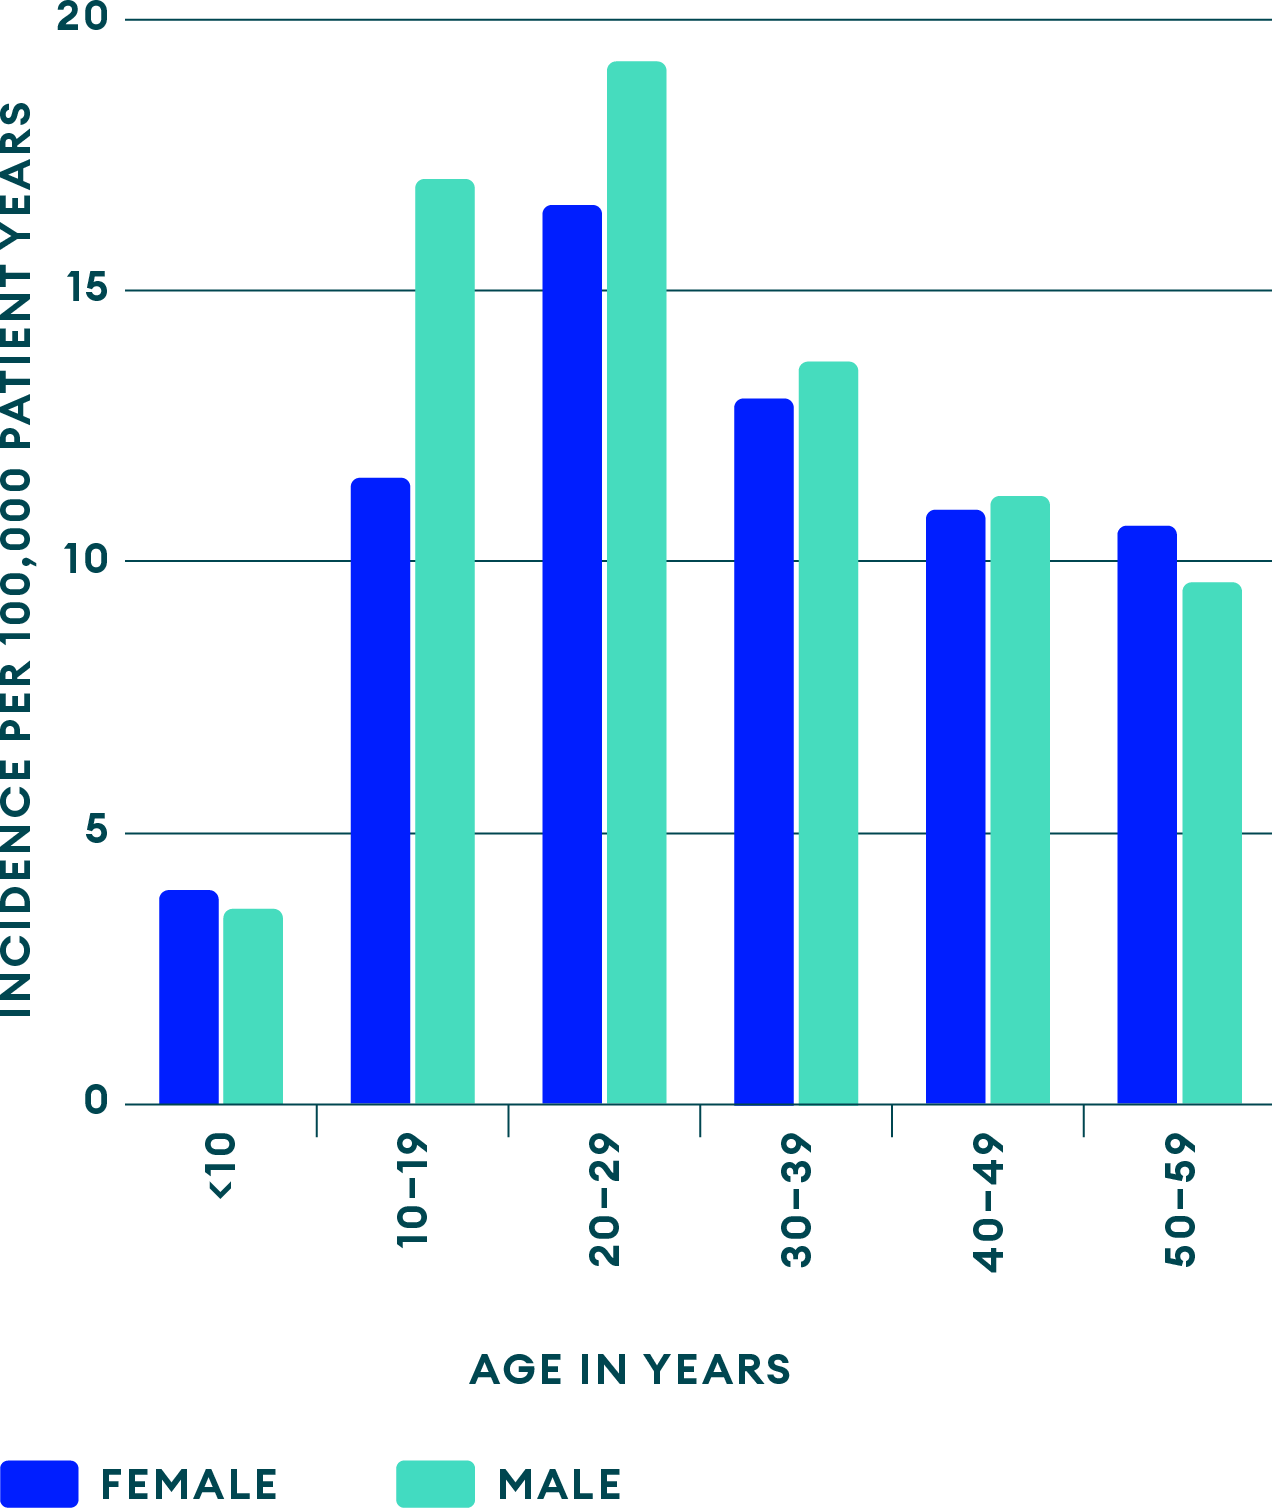
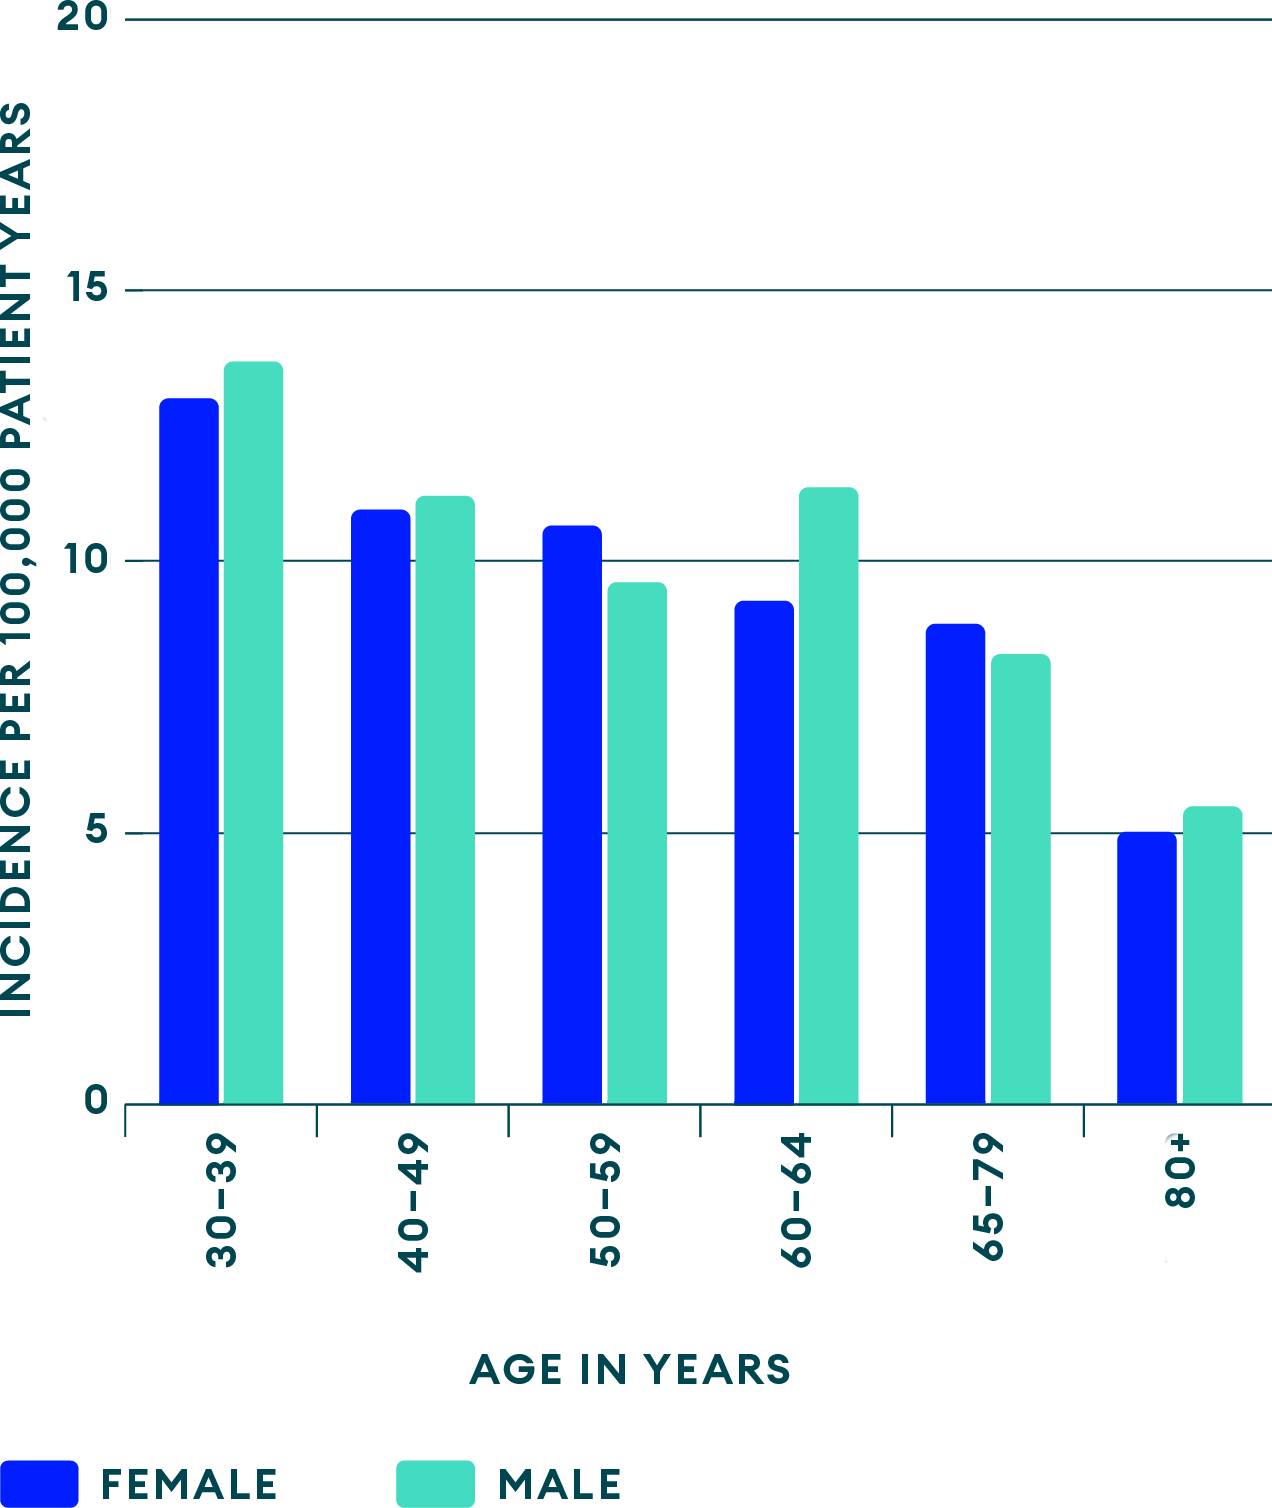
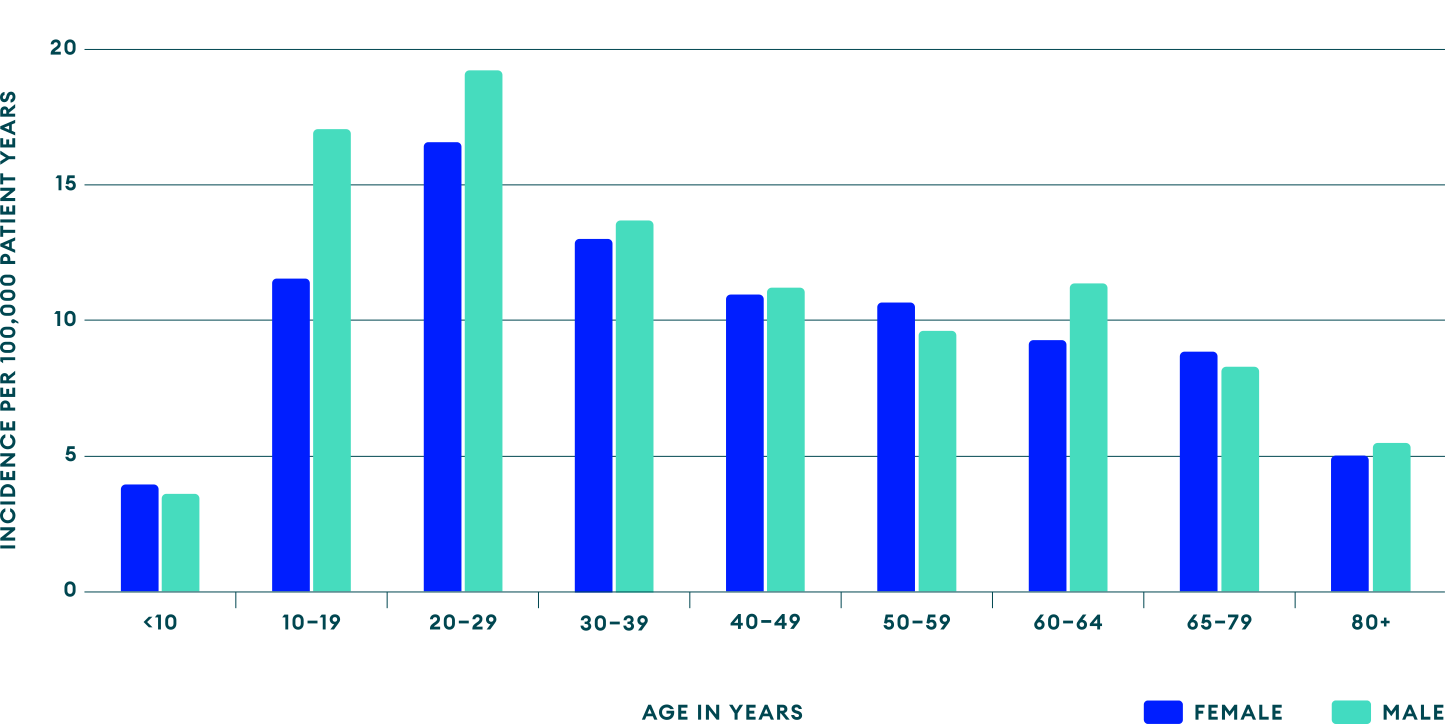
    • IBD incidence by age group in the US3,5

      Peak age of onset Average age at diagnosis Decline to stable level


      Most often ages 31–34

      IBD disease burden data chart, mobile view 1 IBD disease burden data chart, mobile view 2 Chart showing IBD incidence by age group in the US
    • Factors associated with the pathogenesis of IBD

      Combination of contributing factors6

      Icon: genetics

      Genetics

      Icon: gut microbiome

      Altered Gut
      Microbiome

      Icon: dysregulated immune response

      Dysregulated
      Immune
      Responses

      Icon: environmental risk factors

      Environmental
      Risk Factors


      Key environmental
      risk factors2

      Icon: antibiotics

      Antibiotics

      Icon: infections

      Select
      Infections

      Icon: oral contraceptives

      Combined Oral Contraceptives

      Icon: tobacco smoking

      Tobacco
      Smoking

      Icon: processed foods

      Ultra-High Processed
      Foods

      Icon: Western diet

      Western and
      Carnivorous
      Diet

    • Potential challenges to optimizing IBD care

    • Approaches to help improve IBD care

      Icon: early diagnosis

      Early diagnosis and risk stratification

      Elevate HCP awareness of signs and symptoms, and access to specialists/prognostic tools14

      Icon: health equity

      Health equity

      Recognize the needs of minority and LGBTQI+ populations10,11

      Icon: cost-effective care

      Cost-effective care

      Leverage telemedicine, noninvasive biomarkers, biosimilars when appropriate, top-down initiatives, and the promotion of healthy living15

      Icon: multidisciplinary care models

      Multidisciplinary models

      Integrate dietary therapy, psychological care, and various support strategies15

    • CD=Crohn’s disease; ED=emergency department; EIM=extraintestinal manifestation; HCP=healthcare provider; IBD=inflammatory bowel disease; K=thousand; LGBTQI+=lesbian, gay, bisexual, transgender, queer, and intersex; M=million; NSAID=nonsteroidal anti-inflammatory drug; UC=ulcerative colitis.

    • US-NON-10593v1.0 04/26